Jetpack Stats Traffic dashboard empowers you with actionable insights to understand and optimize your website’s performance.
Some features in this documentation are exclusively available to websites with a commercial Jetpack Stats plan or as part of Jetpack Growth and Jetpack Complete bundle plans.
The Jetpack Stats Traffic view
Explore your site’s traffic (views and visitors) via graphs, top posts and pages, website referrer data, visitor locations, top search terms, and more. Filter your data based on custom date ranges and hourly breakdowns. Interactive charts allow you to interact with your site’s traffic data.
To access the Traffic view:
- Go to your site’s WP Admin.
- Then, go to Stats.
- Click the Traffic tab.
The data in this view is updated every 30 minutes.
7-day highlights

Your Traffic view defaults to a 7-day overview. It provides a quick look at the number of your visitors, views, likes, and comments over the last seven days. The trends shown in percentage are also compared to the previous seven-day period.
This section shows your site’s 7-day highlights by default, but you can switch between different periods.
Switch between bar and line charts
Jetpack Stats provides two options to view your traffic: Bar charts and Line charts. Bar charts are ideal for visualizing distinct traffic spikes and comparisons. Line charts help identify patterns and trends over time.
To switch between chart types:
- Locate the chart toggle button in the top-right of the Views section.
- Click the button to switch between bar charts (default) and line charts.

Using date filters
Date filters allow you to view data for relative or custom date ranges and navigate forward or backward in time, depending on the selected range. You access the date filter in the top-right corner of the Traffic page.
Changing and applying any of the ranges from the date filter will update every section of the Traffic view.
Relative date ranges
The relative date range options provide quick access to commonly used time periods:
- Open the date filter.
- Quickly view and choose from commonly used timeframes:
- Today
- Last 7 days
- Last 30 days
- Month to date
- Last 12 months
- Year to date
- Last 3 years
Once selected, your stats will update automatically to display data for the selected range.
Hourly stats for a single day
When you select Today from the date filter or click on a bar graph or a point on a line for any date, you get an hourly breakdown of your stats for that specific date. The hourly graph displays site activity for each hour of the day, starting from midnight.

This hourly breakdown is especially helpful for identifying peak activity periods throughout the day.
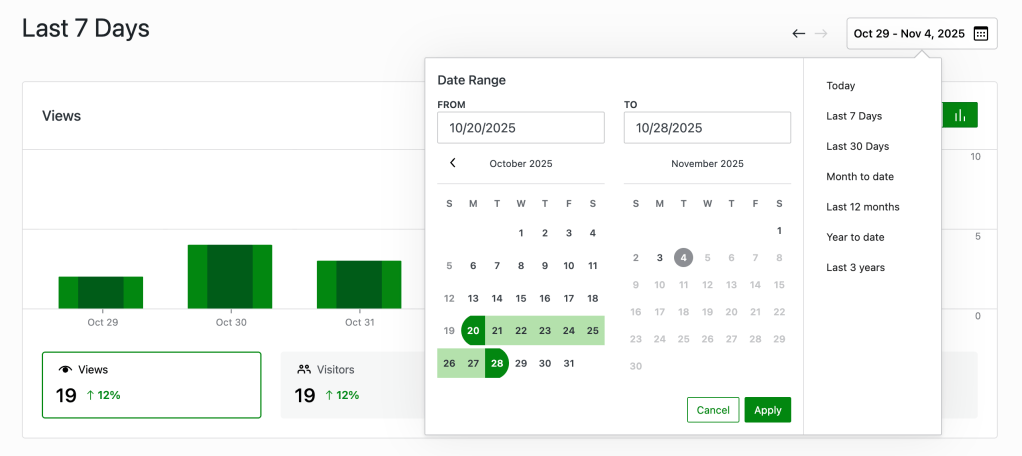
Custom date ranges
For more precise control over the data displayed, you can select a custom date range:
- Open the date filter and choose start and end dates:
- Use the calendars to pick your desired start date in the From field.
- Then, select your end date in the To field.
- Click the Apply button to update the stats.
Interactive navigation
You can drill down into your data by clicking on bars or points on a line in the graph:
- Monthly to Daily view: When viewing a monthly graph, click on a specific bar or point in the line for a single date to zoom into the daily view for that month.
- Daily to Hourly view: Click on a specific bar or point on a line for a specific date to see the hourly breakdown for that day.
You can also use the navigation arrows next to the date range picker to quickly step through a given time period. The Back arrow (←) moves the displayed date range backward. The Forward arrow (→) moves the displayed date range forward. The forward arrow is inactive if you’re viewing data up to the current day.
Adjust the viewing mode for your stats
After selecting a custom or relative date range from the date filters above, choose how your data is displayed using the viewing mode dropdown (days, weeks, months, and years) located beneath the date filter.

- Days: Displays individual daily bars or line trends.
- Weeks: Aggregates data into weekly bars or line trends.
- Months: Groups data by month or shows monthly line trends.
- Years: Shows yearly trends.
Changing the viewing mode does not alter the selected relative or custom date range—it only modifies how the data is presented visually.
Understanding the difference between views and visitors
A view refers to when a visitor loads or reloads a page. A visitor refers to when we see a user or browser for the first time in a selected time frame.
A visitor is an individual looking at your site. A visitor can view your site’s different pages or the same page multiple times. Therefore, you can expect views to be higher than visitors.
Engagement metrics: Likes and Comments
The charts also include tabs for viewing stats for the number of likes and comments on your site. Click the Likes or Comments tabs to display a bar chart for those stats.
Analyzing Popular Posts, Pages, and Archives
Identify your most engaging content by reviewing which posts, pages, and archive views attract the most attention.
How Views Are Counted
Jetpack counts a view when someone directly loads a post, page, or archive URL on your site. Views are grouped into two categories:
- Posts & Pages – for individual content like blog posts, static pages, or the homepage (static and latest posts).
- Archive – for archive-type content like tag pages, search results, 404 errors, and author listings
Posts & Pages
The Posts & Pages card lists individual posts and pages that received direct views. Each item includes a green-tinted bar showing how popular it was relative to other content. You can click any entry to see more detailed insights.
Homepage views
If your homepage is set as a static page, it’s listed under Posts & Pages as Homepage. If your homepage is set to display the latest posts, it appears in Posts & Pages as Homepage (Latest posts).
Archive
The Archive card lists views for archive-type content, including:
- Tag pages
- Category listings
- Author archives
- Date-based archives
- Search result pages
- Error pages (e.g. 404)
- Other taxonomy-based archives
Each archive entry includes a green bar and view count. You can click on grouped entries (e.g., Categories or Tags) to expand them for more details.
Views previously grouped under a general “Home page / Archives” line item are now separated into either Posts & Pages or Archive pages, depending on the type of content.
Exploring Archive views
The Archive card groups views by type, such as Categories, Tags, Searches, and Authors. If there are multiple entries under a type (e.g., multiple tags or categories), you’ll see a small arrow you can click to expand the list.
For example, click Categories to see individual category names and their view counts. Expand Tags or Taxonomies to review detailed archive traffic by taxonomy term.
Each item in the expanded list includes a view count and a green bar representing its share relative to the others in the group.
Viewing more entries
At the bottom of both the Posts & Pages and Archive Pages cards, you’ll see one of the following links based on the number of items:
- View all appears if there are more than 10 items.
- View details appears if there are 10 or fewer.
- View more briefly appears before data is available or when the card is in an empty state.
This pattern is also used across most cards in the Traffic dashboard, including Referrers, Locations, Videos, and Authors. The Devices card is the only exception; it displays all data within the card and does not include a link to expand the card further.
Tracking views for private and password-protected pages
Jetpack Stats tracks private and password-protected content differently from public content.
Password-protected pages
When someone visits the URL of a password-protected page, Jetpack records the view under the page’s title. This occurs whether or not the visitor is logged in and regardless of whether they enter the password to unlock the content. As long as the page is loaded, the visit is counted and shown in the Top Posts & Pages section using the page’s title.
Private pages
For private pages, how the view is recorded depends on whether the visitor has permission to access the content and whether their role is included in Jetpack’s stats tracking.
If the visitor is not logged in or lacks permission to view the private page, Jetpack does not associate the view with the private page’s title. Instead, the view is recorded under the general category “Archive.” This is also where Jetpack logs visits to non-existent URLs (404 errors), which behave similarly in terms of stats tracking.
If the visitor is logged in and has the correct permissions, and their user role is enabled for stats tracking, then the private page view will be recorded using the page’s actual title.
A specific setting in Jetpack controls whether Jetpack counts views from logged-in users. This setting is configured under Jetpack → Settings →Traffic. Under the section labeled “Count logged in page views from,” you’ll find toggle switches for each user role.
You can enable or disable tracking for standard roles like Administrator, Editor, Author, and Contributor, as well as custom roles, including those added by third-party plugins.
This fine-grained control ensures that Jetpack Stats tracks only relevant user activity and counts private content appropriately based on user role visibility.
Referrers
Gain insights into where your visitors come from, whether it’s a blog mention, a social media share, or an organic search.

When someone clicks on a link to your website from one of these sources, it counts as a view associated with that referrer.
If you see a down arrow next to a referrer, you can click on it to get more specific details. For instance, expanding Search Engines will show more information about particular search engine referrers like Google and Bing.
Note: The total number of referrers may not match the total views, as some visitors may come to your site directly by typing the URL, clicking a link in an email, or through another application that opens the browser.
Clicking any of the referrer items will take you to the web address displayed.
Marking spam referrers
Traffic sources differ, and you may consider some referrers to be spam. Internet bots, for example, crawl various websites periodically. While they don’t affect your site’s security, you may not want to include them in your stats.
Note: Your stats won’t be affected by marking a referrer as spam. It will only prevent it from showing up in your referrer stats.
To mark a referrer as spam:
- Go to Traffic → Referrers.
- Hover over the referrer and click the warning symbol next to the URL.
- Click Mark as Spam.

Each referrer on the list has a warning icon next to their view count, except for a few allowlisted ones like WordPress.com.
Marking a referrer as spam sends it to a block list for your site, and it won’t appear in the future on your site stats. This action cannot be undone. If you mark a referrer as spam by mistake and want to unblock it, please contact support.
Referrer discrepancies
Search engines and browsers have tightened their privacy policies in recent years, which has impacted the way referrers and search terms are reported. Specifically, many browsers have started to limit the sharing of referrer data to enhance user privacy. This change means that Jetpack Stats may not always receive referrer information, even when visitors come to your site via a search engine or another site.
This will likely create a discrepancy between the total views/visitors count and the specific referrer numbers reported by Jetpack Stats. As a result, a portion of your site’s traffic may appear as if it’s from direct access, even though it actually comes through search engines or other referrers.
Also, note that we only display 400 unique items. If your referrers count is higher than 400, you may not find some of them listed.
Views by Locations
Visualize how many views your site has received from each country, region, or city by day, week, month, quarter, year, and all time.
Region and city breakdowns are available only with a Jetpack Stats Commercial license.

By default, the Locations section is set to the Countries tab. Click “View all” at the bottom of the Countries tab to open a larger summary map for a more detailed view.
If a visitor’s location cannot be determined, their views will not be reflected in this chart. This may occur if a visitor is using an incognito browser or VPN, and their location will appear as “Unknown Region” on your Stats page.
Regions and Cities
Regions
Use the Regions tab to see where your visitors are coming from and tailor content to their interests.
To access regional data:
- Click on the Regions tab in the Locations section.
- Choose a country from the dropdown to explore regional data. By default, the tab shows All Regions.
- Use the date filters to choose a specific time frame.
Cities
The Cities tab shows views from each city within a region. This level of detail can help you understand urban-specific engagement.
To access city data:
- Click on the Cities tab in the Locations section.
- Choose a country from the dropdown to view city-level insights. By default, the tab shows All Cities.
- Use the date filters to choose a specific time frame.
Harnessing UTM Stats for precision tracking
The Jetpack UTM (Urchin Tracking Module) helps you track your website’s traffic and performance by using UTM codes. UTM codes are snippets of text that you add to your website’s URLs to track things like the source, medium, and campaign of your traffic.
If you are a free or pay-what-you-want user, you will need to upgrade to a commercial plan to gain access to UTM metrics and other advanced features.
The Jetpack UTM module works by collecting data from your website’s traffic that includes UTM codes. You can create these UTM codes by following the guide here: UTM URL Builder. This UTM data is then displayed in a user-friendly report showing how your website’s traffic is performing.
Based on the analysis provided by Jetpack’s UTM module, you can see which campaigns and models are driving the most traffic to your website.
Once you have added UTM codes to your website’s URLs, you can start tracking your website’s traffic in the Jetpack UTM module report under Stats → Traffic. Detailed steps are below:
- Navigate to the Traffic page (Stats → Traffic) within your Jetpack dashboard.
- Look for the stats card labeled “UTM.”
- Use the dropdowns to select different UTM parameters (such as source, medium, campaign, etc.) and get a detailed view of traffic statistics.
With the UTM module, you can choose to view general UTM stats to check the performance of your campaigns with aggregated data, giving you insights into overall traffic origins and behaviors.
You can also delve into UTM metrics tailored for individual posts to understand how specific content is performing.
Authors
This allows you to track the amount of traffic generated by each author, which is particularly useful for websites with multiple contributors. This allows you to recognize and reward contributors based on the traffic they drive to your site. By clicking on an author’s name, you can view their most popular posts and pages, as well as the number of views that each has received.
To hide the Authors section, click the gear (⚙) icon at the top-right corner of the Traffic dashboard to open the “Modules visibility” options, and use the toggle to turn off “Authors”.
Search terms
Visitors to your site used these terms, words, and phrases on search engines to discover content on your site. You can then uncover keywords driving organic traffic and refine your SEO strategy accordingly.
Note: If we don’t know the search terms, we display them as “Unknown search terms.” Certain search engines, such as Google, do not disclose search terms due to privacy concerns.
Clicks
Track user behavior both on and beyond your site to better understand visitor interests and preferences.

The Clicks chart displays the number of times visitors clicked on links within your site, including both external links (links that direct users to other websites) and internal attachment links (such as images or other media hosted in your /wp-content/uploads/ directory). These clicks can occur within your content, comments, user names, and media links.
By tracking both external and internal media clicks, this data offers a comprehensive view of how visitors engage with your site’s content and resources.
Video views
This shows the number of views your Jetpack VideoPress videos have gotten. For a more detailed breakdown of your video stats, click View all at the bottom of the panel. This breakdown contains the following information:
- Impressions: This refers to how many times a video was loaded.
- Hours Watched: The total number of hours viewers have watched the video.
- Retention Rate: How much of the video has been viewed on average.
- Views: This refers to how many times a viewer clicked the play button on the VideoPress player.
To hide the Videos section, click the gear (⚙) icon in the top-right corner of the Traffic dashboard to open the “Modules visibility” options, and use the toggle to turn off “Videos”.
Devices stats
Track and understand which device sizes, browsers, and operating systems visitors use to access your website.
This feature will be exclusively available to websites with a commercial Jetpack Stats plan or as part of a Jetpack Complete bundle plan.
Website owners and developers can use this feature to optimize and tailor their content to match the device attributes of their visitors. Under the Devices card in your Traffic tab, you should be able to see a breakdown of your visitors based on the following device attributes:
- Size ( Desktop, Mobile, Tablet…)
- Browser (Chrome, Safari, Firefox, Edge…)
- (OS) Operating System (Mac, Windows, Android…)
By mastering Jetpack Stats Traffic dashboard, you not only understand your audience better but also craft data-driven strategies to propel your website to new heights. Dive in, explore, and unlock the full potential of your digital presence!
Still need help?
Please contact support. We’re happy to advise.
