
Creating a good user experience (UX) for people who visit your site is important for a number of reasons. A good UX enhances site accessibility and increases the chances that your visitors will engage with your content in deeper ways by exploring your blog, buying your products, or subscribing to your content.
Sites with strong user experiences may also notice increasing visitor numbers, as visitors will want to return to them. Additionally, SEO experts from Search Engine Land believe that good user experiences can have bigger impacts on search engine rankings.
The importance of good user experience has also grown with the rise of mobile internet browsing. Someone using a small screen doesn’t need a site to look beautiful as much as they need it to be laid out clearly, with an easy process for finding and consuming content.
A site with great UX will offer content that’s clear and readable, has an intuitive navigation system in place, a logical structure, tools such as search, and forms that are easy to use.
So, if you want your site to succeed, you’ll want it to have a good UX. But, how can you measure yours? There are a number of ways to test UX, including feedback, test sessions, and hands-on testing conducted yourself.
In this article, you’ll learn about some of the Jetpack tools you can use to measure the success of your user experience, and identify ways you can make improvements.
1. Get deeper UX insights with Google Analytics
For many site owners, Jetpack’s Site Stats provides enough information. However, if you’re really serious about analyzing your UX, you may want to look into Google Analytics as well.
Google Analytics is a free service that complements Jetpack’s stats with in-depth insights into your site.
Google Analytics will let you see which links people are clicking on, and where they are leaving your site. This gives you a starting-off point when identifying where there may be UX issues and room for improvement.
2. Track the visitor journey
One way to measure user experience is by tracking the “journey” that people take when navigating your site. In other words, you can measure how many pages the average visitor opens and what order they open them in.
This will help you measure the success of your UX, allowing you to identify which pages they’re most likely to go to, and how they get there.
Google Analytics shows you this user journey on its Behavior Flow page. Here’s an example of what a Behavior Flow page might look like:

The “Starting Pages” column identifies where people are most likely to enter your site. It then branches off into the different pages visitors might access next under the “1st interaction” column, which refers to the first action they take on your site.
3. Locate where people leave
You can also use Google Analytics to identify which pages people are leaving your site from via the Exit Pages view. This will help you identify pages that aren’t sufficiently engaging.
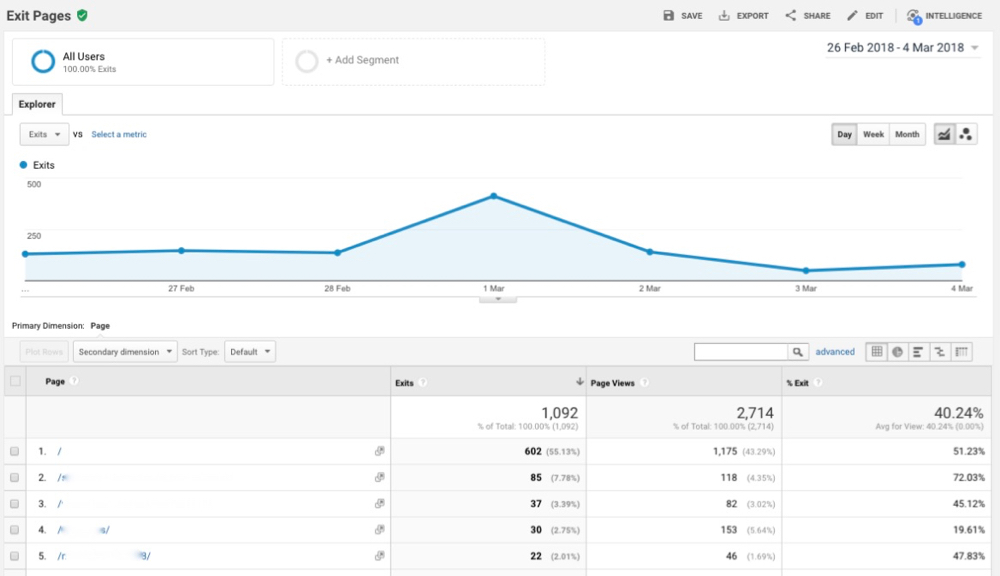
Of course, people are going to leave your site eventually, so if the most common exit page is a checkout page or a sign-up page, you’re probably doing fine. If a lot of people are exiting from your homepage, though, then there may be something in your UX that isn’t engaging enough.
4. Identify progress barriers
You might want people to spend more time on certain pages than others. Perhaps you want them to read a longer blog post, take the time to fill out a contact form, or browse your product pages. But in other cases, you might want them to quickly pass through a page and onto something else.
If you can measure how long people are spending on a page, it can help you identify whether it offers a good UX that encourages people to move on to the next thing that you want them to see.
In this example, users are spending an average time of just under two minutes on a homepage:

A homepage is a typical starting point, as it’s more or less a collection of links designed to help people navigate through a site to find other content. Ideally, you’d like them to spend less time on it.
A possible explanation could be that there are so many links on this homepage that it’s taking too long for people to find what they’re looking for. This statistic could help the site owner redesign the homepage to provide a better UX by reducing the number of links.
5. Track events
The event tracking tool in Google Analytics can be used to measure the user-friendliness of your links.
For example, if a button isn’t being clicked, it might not be noticeable enough. If a link close to the button is being clicked on by accident, maybe the button isn’t big enough for people to tap on mobile phone screens.
Activating Events in Google Analytics lets you identify the actions that visitors can take (such as clicking a link) and then track how many visitors are doing so. This way, you can identify the links that aren’t getting clicked as often as you’d like, and can make improvements to them.
6. Use data to guide user testing
All of this data is a great starting point for identifying where you may need to improve UX. But it doesn’t give you all the information you need. For that, you’ll want to conduct some user testing.
This involves setting up tasks commonly performed on your site, and asking users to carry them out and give you feedback once completed. You should observe this to see where people slow down or get stuck. You can sit with your users in-person, have a video conference with them, or use a heat mapping tool such as Crazy Egg.
The analysis you already gathered will help to identify what tasks and pages you should test, which will make your testing process a lot more streamlined.
Good user experiences begin with measurement
Many people believe that UX is just about design, and that an attractive site automatically equates to great user experiences.
But, it’s usually not that simple. To improve your UX, you should measure what visitors are doing on each of your site pages and whether they’re finding it easy enough to engage with your content.
Using tools like Google Analytics can help you understand where your site may have UX issues, so you can then carry out focused user testing.
Do you have any tips or tricks for measuring the success of your UX? Let us know in the comments!
