
At Jetpack, we’ve analyzed thousands of websites using our website speed and performance tools. A common question we get is not if speed matters, but how to measure it accurately. Different tools give different scores, reports are filled with cryptic metrics, and it’s hard to know which recommendations actually work.
This guide cuts through the noise. We won’t just list tools; we’ll show you which tool to use for your specific situation, how to interpret the results, and how to prioritize fixes that deliver real speed gains.
The main website speed metrics to know
Website speed is actually a blend of various metrics, each shedding light on a different aspect of site performance. By understanding these individual metrics, you can pinpoint the exact issues affecting site speed and, in turn, rectify them.
Time to First Byte (TTFB)
Time To First Byte measures the time it takes for the user’s browser to receive the first byte of data from the server after a request has been made. It’s generally considered a reflection of server speed, although other factors can also play a part. A shorter TTFB indicates a quicker server response.
First Contentful Paint (FCP)
First Contentful Paint represents the time it takes for the first piece of content (like text or an image) to render on the screen. This metric offers insights into the perceived speed of a site from the visitor’s perspective.
First Input Delay (FID)
A crucial measurement of user interaction, First Input Delay captures the time between when a user interacts with part of the site (like a link) and when the browser starts processing that interaction. However, you should note that FID will be replaced by Interaction to Next Paint (INP) in March 2024.
Largest Contentful Paint (LCP)
A continuation of FCP, Largest Contentful Paint measures the rendering of the most substantial piece of content visible in the viewport. It’s an excellent indication of how quickly primary page content becomes available to users.
Cumulative Layout Shift (CLS)
Cumulative Layout Shift gauges the stability of a page as it loads. It quantifies unexpected layout shifts, which happen when content keeps moving as the page loads. This can be particularly annoying for visitors!
Time to Interactive (TTI)
As the name implies, Time to Interactive evaluates the time it takes for a page to become fully interactive. This is when elements respond to user inputs and the page works smoothly without lagging.
Total Blocking Time (TBT)
Total Blocking Time is a metric that quantifies the total time between FCP and TTI, where the main thread is blocked long enough to prevent input responsiveness. This is useful to understand how much non-interactivity a user faces after content starts rendering.
Speed Index (SI)
Finally, Speed Index represents how quickly content is displayed during page load. Lower values are better, as they indicate that the content is displayed to the visitor more promptly.
When evaluated together, these metrics provide a holistic view and measurement of site speed. However, understanding them is just the first step. The next is evaluating them through reliable tools, which can lead to actionable insights for improvement.
Six accessible tools to test your website speed
| Tool | Best For | Key Feature | Price |
| Jetpack Boost | WordPress users seeking one-click improvements | Automated optimizations (Critical CSS, Caching, Image CDN) | Free |
| Google PageSpeed Insights | Quick Core Web Vitals check | Official Google metrics & recommendations | Free |
| GTmetrix | In-depth developer analysis | Detailed waterfall chart & performance history | Free (with paid plans) |
| WebPageTest | Advanced, granular testing | Test from global locations & various devices | Free |
| Pingdom | Uptime & performance monitoring | Simple interface & historical tracking | Paid (with free test) |
| Lighthouse | Auditing within your browser | Integrated into Chrome DevTools | Free |
Testing website speed might seem like a daunting task, especially for those new to the technical aspects of website management. However, a range of tools, each with its unique capabilities, can facilitate this process. Below, we’ll explore six of these site speed testing tools.
1. Jetpack Boost
In the WordPress ecosystem, site owners understand the importance of plugins in enhancing their site’s capabilities. Jetpack Boost is one of the best — offering both site performance testing and optimization solutions tailored to WordPress.
How to use Jetpack Boost
To install Jetpack Boost, navigate to your WordPress dashboard. Go to Plugins → Add New and search for “Jetpack Boost”. Click on Install → Activate.
Once activated, Jetpack Boost will appear in your dashboard menu. Clicking on it will take you to its dedicated interface.
In its dashboard, you’ll find an option to Analyze Site, enabling you to measure WordPress site speed. Click this to initiate a comprehensive scan of your site and evaluate its performance across various metrics.
Beyond testing, Jetpack Boost offers modules like Critical CSS, Defer Non-Essential JavaScript, and Lazy Image Loading. Enabling these will assist in improving scores, especially in metrics like FCP and LCP.
Interpreting the results
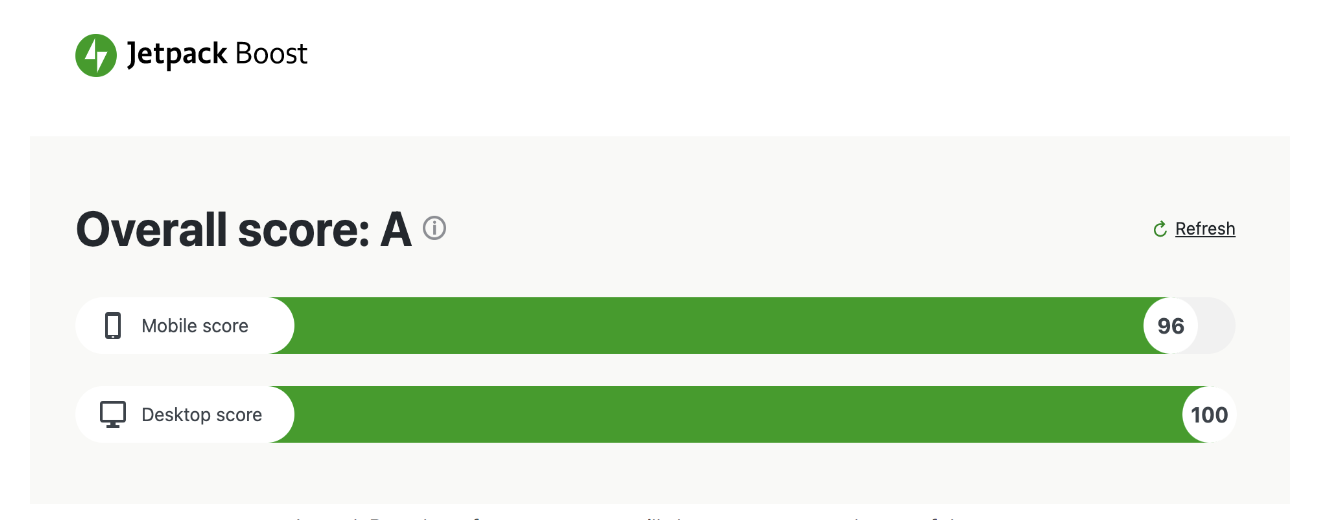
Jetpack Boost presents performance testing results in a structured manner. Here are the metrics you’ll be able to review:
- Overall score. At the top, you’ll find an overall performance score. A score closer to 100 indicates excellent performance.
- Metric breakdown. Below the overall score, the tool provides a breakdown of individual metrics like LCP, FID, and CLS. Green indicates good performance, orange signifies areas that need some attention, and red points to critical issues.
- Recommendations. Along with scores, Jetpack Boost suggests actionable recommendations. Following these will assist in optimizing WordPress site performance.
Understanding and interpreting these results is a springboard to website optimization. Jetpack Boost not only pinpoints areas of concern but also provides tools to address those, making it an essential asset for WordPress site owners aiming for excellence in site performance.
2. Google PageSpeed Insights
Google PageSpeed Insights has a coveted position in the world of website speed testing. Its authority and comprehensive analytics makes it a top choice for many website owners and developers. Harnessing the analytical prowess of Google, PageSpeed Insights offers actionable advice for both novice and professional site administrators.
How to use PageSpeed Insights
To start, navigate to the Google PageSpeed Insights official website.
Next, you’ll simply enter the URL of the page you want to review and click Analyze.
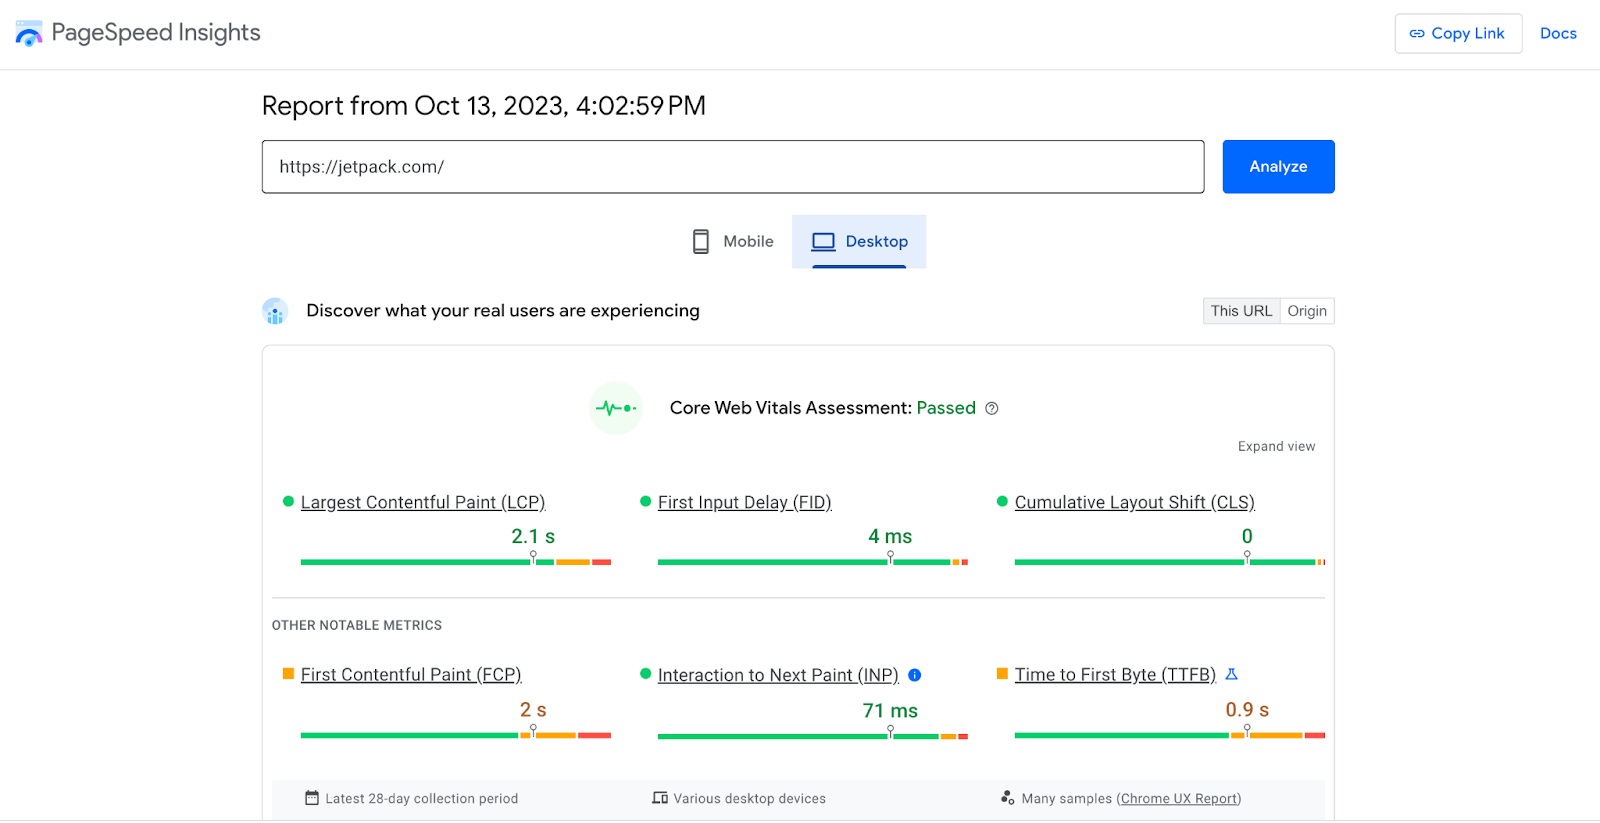
After a few seconds, PageSpeed Insights will offer two main tabs — one for mobile and another for desktop. This will help you understand how your site performs across devices.
Interpreting the results
- Performance score. The analysis commences with an overarching score out of 100. Higher scores (90-100) reflect good performance, mid-range scores (50-89) indicate room for improvement, while lower scores (0-49) suggest that significant enhancements are required.
- Core Web Vitals. PageSpeed Insights also delves into Core Web Vitals — metrics like those we discussed earlier that Google uses to determine the quality of your site’s user experience. Here, you can evaluate your site’s LCP, FID, and CLS scores.
- Opportunities. One of the standout features of PageSpeed Insights is the “Opportunities” section. It highlights potential interventions that could significantly reduce page load times. For instance, it might suggest image optimization or server response time reduction.
- Diagnostics. Beyond opportunities, the “Diagnostics” section provides insights into other areas that don’t necessarily affect the performance score but are important for web development best practices.
3. GTMetrix
GTMetrix is a powerful tool to assess website speed and performance, enjoying the trust of developers and site owners alike. By delivering in-depth insights coupled with actionable recommendations, GTMetrix effectively illuminates the pathway towards better website speed and optimization.
How to use GTMetrix
Begin by heading to the GTMetrix official website.
On the homepage, enter the URL of the site you want to evaluate.
Click Test your site. The analysis will begin immediately and likely only last a few seconds.
Note: GTMetrix offers a feature where users can select the location from which the website should be tested and the browser to use for the test. This feature is vital, as website speed can vary based on geographic locations and browsers.
Interpreting the results
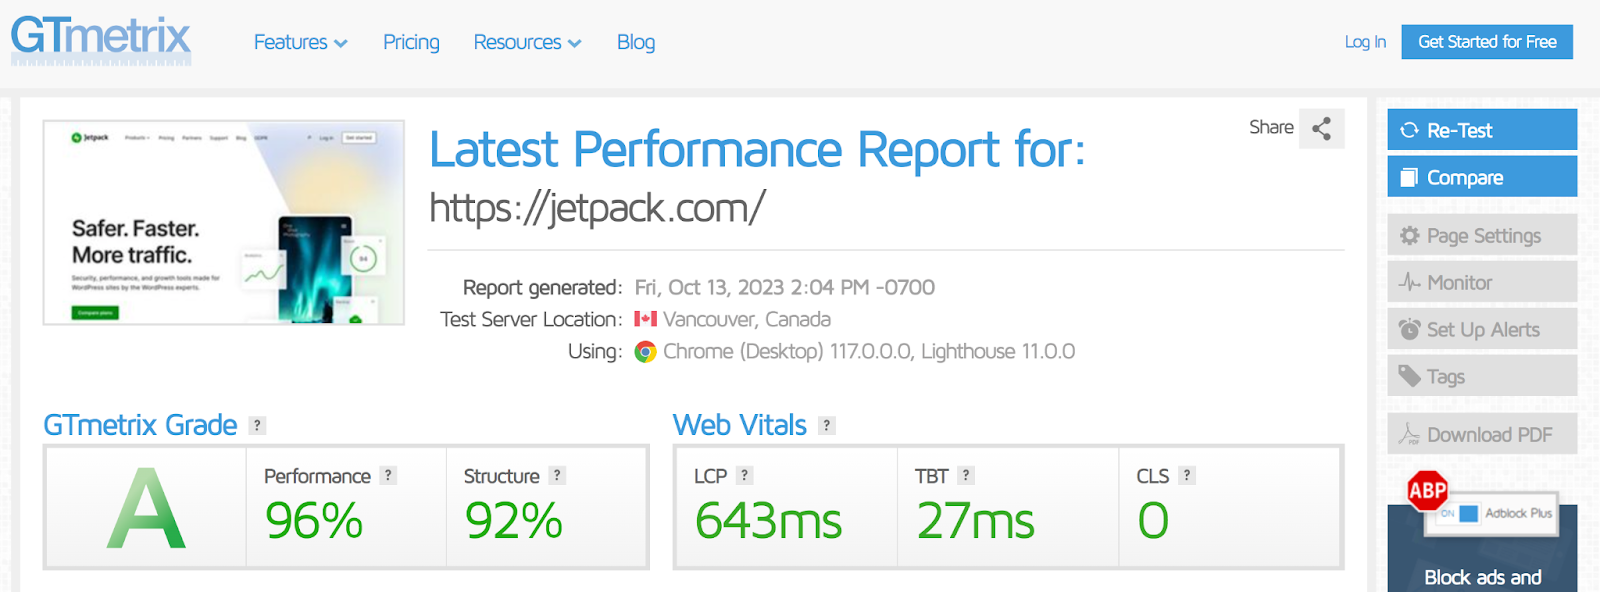
- PageSpeed and YSlow scores. GTMetrix incorporates Google’s PageSpeed Insights and Yahoo’s YSlow metrics, providing two distinct scores. These metrics evaluate various factors affecting site speed, with recommendations for improvement accompanying each score.
- Page load details. The tool breaks down the load time, total page size, and the number of requests. This is helpful to identify bottlenecks and areas of concern.
- Waterfall chart. One standout feature of GTMetrix is the waterfall chart, a visual representation of how each element on the site loads. Through this chart, one can identify slow-loading elements that might be hampering the overall load time.
- Recommendations. Based on the analysis, GTMetrix provides a series of actionable recommendations. These might range from reducing server response times to optimizing images.
4. WebPageTest
WebPageTest, known for its comprehensive performance analysis, is a popular tool for website developers and owners. By offering precise metrics and in-depth evaluations, it paints a clear picture of a website’s speed and usability.
The granular insights afforded by WebPageTest provide a foundation for informed decisions regarding speed optimization. To make the most of WebPageTest, you need to understand how to use it and properly interpret the results.
How to use WebPageTest
Start by visiting the official WebPageTest website. The homepage greets you with a user-friendly interface where you can enter the website URL for the site you’d like to inspect.
Before launching the test, WebPageTest offers advanced settings that let you choose the test location, browser, and even connection type. This flexibility aids in emulating real-world user scenarios, ensuring that the results mirror actual user experiences across varied environments.
With configurations set, click Start Test to begin the evaluation.
Interpreting the results
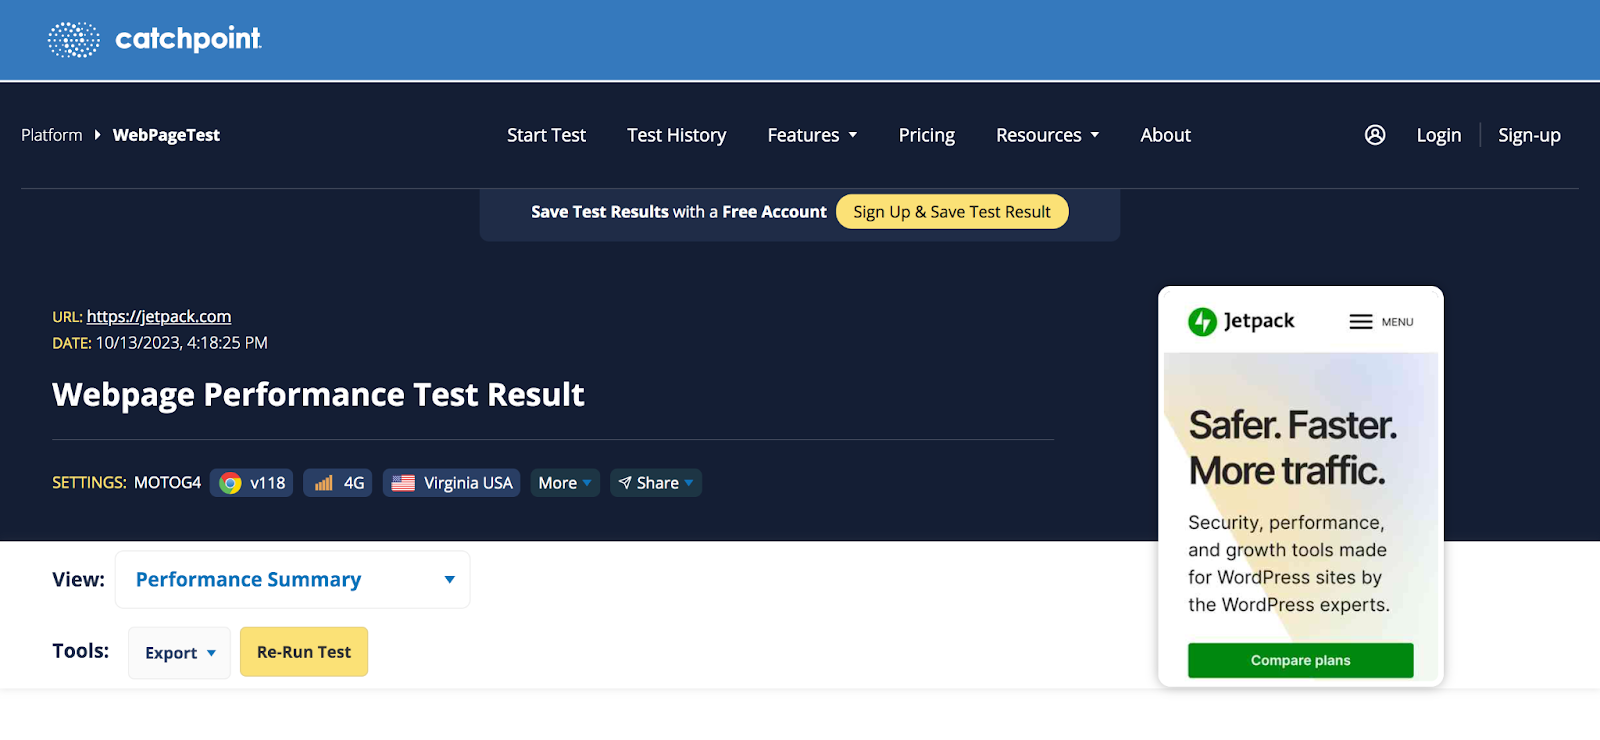
- Performance grade. One of the first metrics presented is the “Performance Grade,” an aggregate score derived from various speed and optimization tests. This score offers an instant gauge of a website’s performance health.
- Load time breakdown. WebPageTest provides a comprehensive timeline, detailing when each element of the webpage loads. This timeline is pivotal for developers when trying to discern which components are hampering performance.
- Content breakdown. Beyond load times, the tool offers a breakdown by content type, shedding light on the volume of images, scripts, and other elements. Recognizing which content types dominate can provide direction for optimization efforts.
- Waterfall view. A staple of WebPageTest, the “Waterfall View” chronicles the load sequence of every single element on the webpage. This visual representation, reminiscent of a cascading waterfall, pinpoints bottlenecks with precision.
- Optimization checks. WebPageTest doesn’t merely highlight problems. It pairs every issue with actionable recommendations.
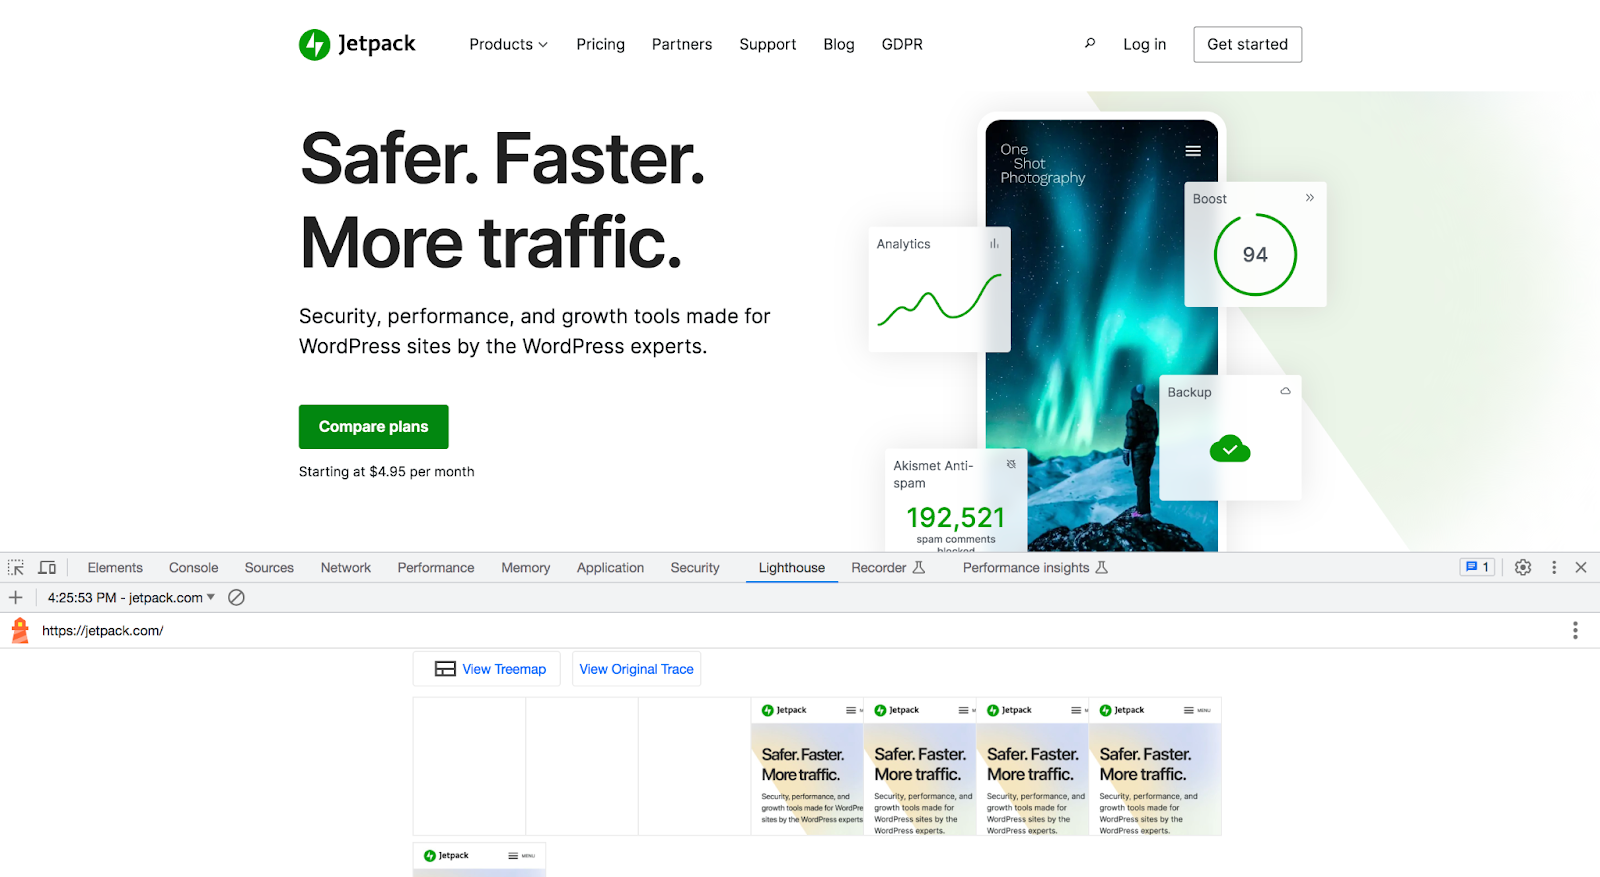
5. Lighthouse
Google’s Lighthouse, an open-source, automated tool designed for web page quality assessment, emerges as a beacon for those looking to find the safe shore of strong performance, accessibility, and search engine optimization.
Its multifaceted approach offers a panoramic view of a website’s health. This robust tool not only charts areas of improvement, but also offers guidance on elevating website standards. The synergy of Lighthouse and Jetpack Boost encapsulates a powerful formula for WordPress site owners to augment their digital presence.
The easiest speed optimization plugin for WordPress
Jetpack Boost gives your site the same performance advantages as the world’s leading websites, no developer required.
Boost your site for freeHow to use Lighthouse
One of the most seamless ways to utilize Lighthouse is through the Chrome browser. Navigate to the webpage you wish to evaluate.
Right click and choose Inspect. Then, choose the Lighthouse tab. You can select everything you want to analyze (make sure you at least choose Performance) and then click Analyze page load.
Interpreting the results
- Scores. Post-evaluation, Lighthouse furnishes a score for each chosen category. These numbers, ranging from 0 to 100, represent the health of the website in relation to that category. Higher scores indicate better performance.
- Metrics breakdown. Within the performance category, you can see more distinct metrics such as First Contentful Paint and Time to Interactive.
- Opportunities. Lighthouse doesn’t merely highlight deficiencies. The “Opportunities” section delineates actionable steps to rectify performance bottlenecks.
- Diagnostics. This section unravels more granular details about the website, exposing potential pitfalls in areas like payload size and render-blocking resources.
- Passed audits. Rejoice in your website’s strengths. This section celebrates elements that adhere to best practices, validating the areas where your site shines.

6. Pingdom
Pingdom serves as a comprehensive solution for those striving to elevate their online presence. Distinguished by its user-centric metrics, dynamic visualizations, and exhaustive insights, Pingdom equips website managers with the necessary knowledge to fortify their site’s user experience.
How to use Pingdom
Navigate to Pingdom’s website speed test page. Here, you can input the URL of the site you wish to evaluate.
Before diving into the assessment, you can select from various testing regions. This selection ensures that site performance is gauged from different geographical standpoints, echoing the experiences of your actual user base.
Once the URL and region are selected, click on Start Test to set the wheels of evaluation into motion.
Interpreting the results:
- Performance grade. Pingdom offers an overarching performance grade, a calculated score between 0 and 100. This number represents the website’s optimization level. A high score signals harmony between user expectations and site performance.
- Load time and page size. Crucial metrics such as the total load time of the page and its size in megabytes are spotlighted. These figures offer a direct perspective on a site’s efficiency.
- Requests. Each element on a webpage — from scripts to images — necessitates a separate server request. Pingdom enumerates these, offering insights into the number of requests made during the page load.
- Waterfall analysis. Perhaps the most visually striking feature of Pingdom’s results is the waterfall chart. This graph lays out each request’s timeline, revealing potential bottlenecks or delays in content delivery.
- Performance insights. Beyond raw metrics, Pingdom presents an analysis section. This segment pinpoints areas of improvement, backed by suggestions on best practices.
Key factors affecting website speed
While many businesses allocate considerable resources to design and content, it’s often the nuances of technical performance that define the longevity of user engagement.
Ensuring optimal website speed is no longer just about being technically proficient — it’s about being user-centric. Before venturing into the solutions, such as the seamless efficacy of Jetpack Boost, it’s pivotal to diagnose the typical culprits of slowdowns.
1. Hosting quality
At the heart of every website lies its host, the very platform from which its data emanates. Not all hosting services are created equal. Shared hosting might be economical, but it comes with the caveat of shared resources, leading to potential traffic bottlenecks. On the other hand, dedicated or cloud hosting offers robustness at a premium.
2. Heavy and oversized images
High-resolution images can be breathtaking, yet their digital weight can exert a palpable pressure on load times. While quality is paramount, so is rendering efficiency, which underscores the need for image optimization without compromising visual integrity.
3. Inefficient CSS and JS handling
Every aesthetic element and interactive feature relies on Cascading Style Sheets (CSS) and JavaScript (JS). However, redundant or un-minimized code and the way these elements load can substantially affect speed.
4. Plugins and themes
The allure of plugins and themes is undeniable, granting functionalities and aesthetics with minimal effort. Yet, an overload of plugins or choosing a poorly coded one can negatively impact a site’s performance.
5. Third-party scripts
Whether it’s analytics, advertising networks, or chatbots, third-party scripts introduce external dependencies. Each additional script implies another potential point of failure or delay, especially if these servers are slow or face issues.
6. Lack of caching
Every website visit involves a sequence of requests and data transfers. Caching is the art of storing some of this data locally, ensuring that repeat visits don’t involve redundant data fetching. Absence or misconfiguration of caching mechanisms can result in avoidable load delays.
7. No content delivery network (CDN)
A CDN is like a global relay team, fetching website data from a location closest to each individual visitor. Without one, every visit fetches data from the primary server location, leading to variable and often elongated load times.
Frequently asked questions about website speed testing
Why is website speed important?
Website speed is a cornerstone of the digital user experience. Fast-loading sites tend to reduce bounce rates, retain visitors longer, and translate into better conversion rates.
Furthermore, search engines factor site speed into their ranking algorithms, influencing your site’s ability to attract new visitors.
How often should I test my website speed?
Regular monitoring is key. It’s recommended to test your website speed after any significant update or change. However, a monthly check can help identify any issues that might inadvertently creep in.
Is there a difference between desktop and mobile speed testing?
Absolutely. With mobile devices having different processing capabilities and often relying on cellular networks, website loading dynamics differ from their desktop counterparts. Mobile speed testing considers these factors and reviews mobile-specific features like viewport settings and touch-friendly design elements.
What is the difference between Lab Data and Field Data in PageSpeed Insights?
The simple answer is that Lab Data comes from a single test done in a controlled setting, while Field Data comes from your actual visitors. Lab Data is a snapshot taken by Google’s servers to diagnose problems.
Field Data, also called the Chrome User Experience Report (CrUX), collects speed information from real people visiting your site over the last 28 days. Google uses this real-world Field Data for its search rankings, which makes it the most important set of numbers to watch.
Is a 100/100 score on PageSpeed Insights necessary?
No, getting a perfect 100/100 score is not necessary and often not possible for most websites. Modern sites use many scripts for analytics, ads, and features, which makes a perfect score very difficult to achieve.
Your main goal should be to pass the Core Web Vitals assessment. This means getting a “Good” rating for Largest Contentful Paint (LCP), Interaction to Next Paint (INP), and Cumulative Layout Shift (CLS). Focus on providing a fast experience for users, not on hitting a perfect number.
Why are my speed scores different across GTmetrix, PageSpeed Insights, and WebPageTest?
Your scores are different because each tool measures website speed in its own unique way. They use different server locations, internet connection speeds, devices, and browsers for their tests.
For example, a test from a server in London will be slower than one from Dallas if your website is hosted in the United States. Instead of trying to get a perfect score on every tool, pick one primary tool, like GTmetrix, and use it consistently to track your improvements over time.
What is a “waterfall chart” and how do I read it?
A waterfall chart shows you every single file that your website has to load to appear on a screen. Each file, such as an image, script, or font, is listed as a separate bar on the chart. The length of the bar shows how long that file took to load. By looking for very long bars, you can easily spot the exact items that are slowing your site down.
It is a powerful tool for finding specific problems, like an oversized image or a slow script from another website.
What are Core Web Vitals and why do they matter for SEO?
Core Web Vitals are three specific metrics that Google uses to measure the real-world user experience of a webpage.
These metrics are Largest Contentful Paint (LCP), which measures loading performance; Interaction to Next Paint (INP), which measures interactivity; and Cumulative Layout Shift (CLS), which measures visual stability.
Because Google uses these metrics as a ranking factor, having good Core Web Vitals scores can help your website appear higher in search results and provide a better experience for visitors.
How many times should I run a website speed test to get an accurate result?
You should run a speed test at least three times in a row to get an accurate result. The first time you run a test, your website’s files may not be cached, or saved, by the server, which can make the result seem slower than it really is.
By running the test multiple times, you allow the caching to work properly and get a more stable and realistic measurement of your site’s true performance. Always use the average of the second and third tests for your analysis.
What is a good page load time to aim for?
For the best user experience and SEO results, you should aim for a page load time of under two seconds. Research shows that visitors become impatient and are more likely to leave if a page takes longer than three seconds to load.
For key landing pages or e-commerce sites, aiming for under one second is even better. The faster your page loads, the happier your visitors will be, which can lead to better engagement, more conversions, and higher search rankings.
The easiest speed optimization plugin for WordPress
Jetpack Boost gives your site the same performance advantages as the world’s leading websites, no developer required.
Boost your site for free